Doncaster’s average house price reached £173,000 in August 2026, up 3.8% from a year earlier, according to the latest official local figures. That was ahead of the 1.8% annual rise across Yorkshire and the Humber over the same period. The August house price figures are provisional and may be revised. Office for National Statistics
The national headlines this month tell a different story. Lloyds reported that UK house prices in its index fell 0.6% in October compared with September. The two reports cover different periods and use different data. If you’re planning a move in Doncaster, recent sales of similar homes in the neighbourhood you’re looking at can give you a clearer idea of what to expect. Lloyds House Price Index
What are homes selling for in Doncaster?
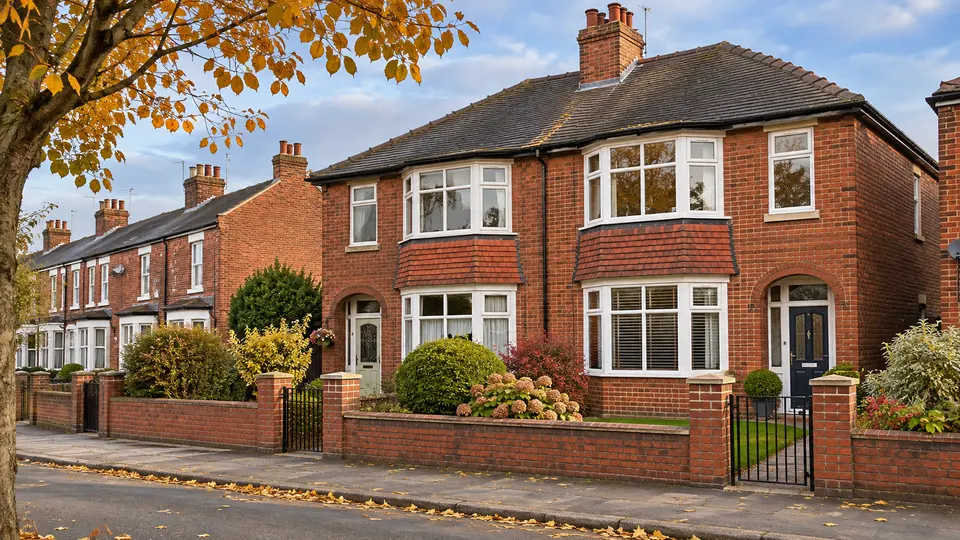
The average price varied by property type in August. Terraced homes averaged £135,000, semis £170,000 and detached homes £262,000. First-time buyers paid £156,000 on average across all property types. Office for National Statistics
If you’re buying, look at what similar homes have actually sold for alongside what’s currently advertised. If you’re selling, compare homes with a similar number of bedrooms, condition and features. Parking, a larger garden or a recently updated kitchen can make a difference even between two homes on the same street.
What’s happening with Doncaster rents?
Average private rent in Doncaster reached £699 a month in September, up from £664 a year earlier. Two-bedroom homes averaged £641 a month, while three-bedroom homes averaged £763. Office for National Statistics
If you’re looking to rent, factor in council tax, energy bills and travel costs as you compare properties. If you’re letting a home, look at similar rentals in the same area to see how your asking rent compares.
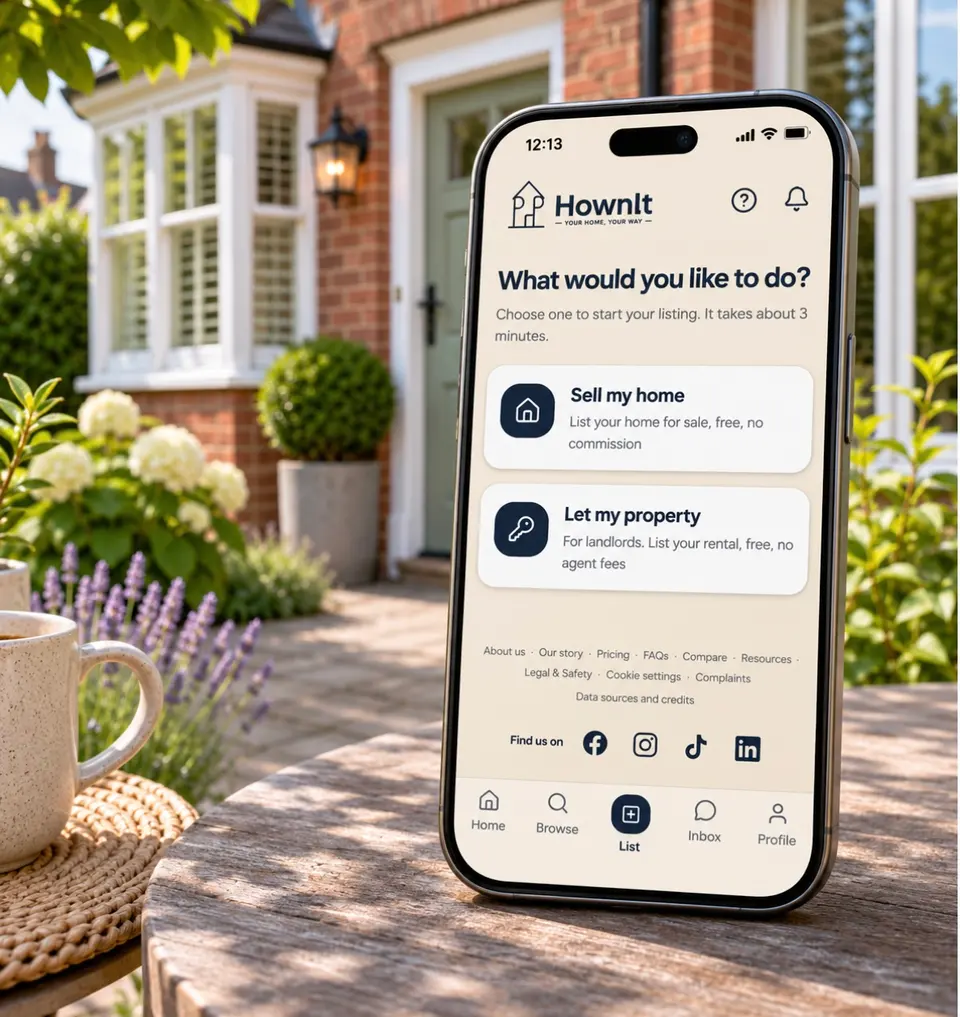
Whether you’re looking for your first home, getting ready to sell or advertising a rental, you can browse or list local properties at HownIt.